Showing posts with label Visualization. Show all posts

Google Music Timeline

Donal Trung 4:40 PM Add Comment
Google found a great way to use the data from the people who uploaded songs to Google Play Music. Google Music Timeline "shows genres of music waxing and waning, based on how many Google Play Music users have an artist or album in their music library, and other data (such as album release dates). Each stripe on the graph represents a genre; the thickness of the stripe tells you roughly the popularity of music released in a given year in that genre."


The timeline starts in 1950, data is is normalized by the total number of albums from a certain year and there's no classical music.

Mouse over a genre to find popular albums, search for an album or artist.

{ via John Mueller }

Real-Time Site Search Visualization

Donal Trung 11:52 AM Add Comment
If you like the full-screen Google Trends visualization that shows the latest hot searches, there's a cool project that uses the same animations to show Google Analytics searches in real time. It's made possible by the recently launched Google Analytics Real Time Reporting API and it shows your site's internal searches, as well as some of the Google searches that lead to your site.


"You can setup your own site visualization in only two steps: first authorize access to your Analytics data, select your site, and set the query parameter for your site searches, usually the letter q. Click save, and see your visitor's searches appear live as a beautiful visualization," explains Yvo Schaap, who developed the service.

Here's a video that shows how to use this addictive mashup:


According to the site, Live Site Search Visualisation is "a dashboard visualizing live search activity on your site using your existing Google Analytics tracking." It also shows Google search referrals. Just like in Google Trends, you can click the top-left corner to select the number of keywords that are displayed at a time.


Just in case you're worrying about this, the site does not "save any data coming from your Google Analytics account on its servers. All data requests are made client-side only over https."

{ Thanks, Yvo. }

Visualizing Android Activations

Donal Trung 1:53 AM Add Comment
This video from Google lets you visualize the evolution of Android activations from October 2008 to January 2011. HTC Dream/G1, the first Android device, was launched in the US and the UK in October 2008 and it became available in other countries in 2009, but it wasn't until the launch of Motorola Droid in November 2009 that Android became popular.


Android Central says that this is "a staggering reminder of just how far Android has come in a relatively short amount of time". Eric Schmidt has recently mentioned that the average number of daily Android activations is now 350,000, up from 300,000 in December, 200,000 in August and 60,000 in April 2010.

Google Suggest Venn Diagrams

Donal Trung 5:49 AM Add Comment
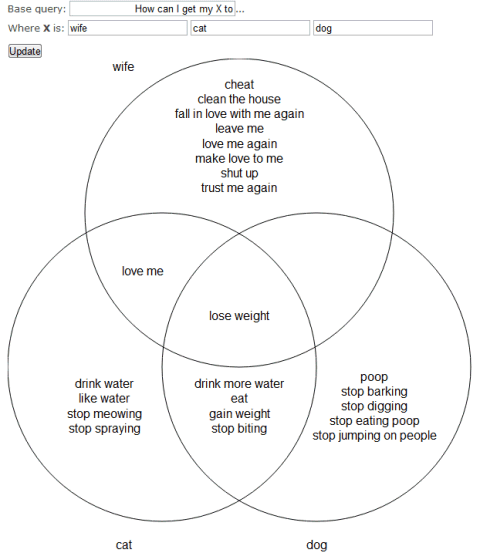
Google Suggest Venn Diagram Generator is a visualization tool for popular Google searches. Enter an incomplete query, replace one of the keywords with "X", add three options for "X" and the tool will find the overlapping suggestions.

For example, if you enter "How can I get my X to", where "X" is: "wife", "cat", "dog", you'll find overlapping suggestions like: "How can I get my {wife, cat, dog} to lose weight", "How can I get my {cat, dog} to gain weight".


Hacker News readers came up with a lot of funny examples:

* Why is {America, Canada, Europe} so ...
* My {friend, wife, husband} is addicted to ...
* Why are {Chinese, Korean, Japanese} so ...
* Why is {C, PHP, Java} so ...

You should keep in mind that Google's suggestions are determined algorithmically based on the popularity of the search terms, so you'll find many stereotypes.

Exploring Google Suggest

Donal Trung 1:53 AM Add Comment
What Do You Suggest? is a site that lets you visually explore how Google Suggest autocompletes a query. "What Do You Suggest takes a seed from you, then guides you on a journey through language and the collective lives of Google users."


Simon Elvery, who created the site, found a lot of interesting patterns:
There are some recurring themes which have emerged as I've been playing with the site during its creation. Among other things, it seems people do rather a lot of searching on the topics of music, religion and relationships.

Sometimes the results are sad, like the people searching for free ebooks on relationships for dummies, and sometimes hopeful like looking for love.

Health is also a recurring theme with the names of medicines, diseases and symptoms appearing over and over again.

{ via Information Aesthetics }